- preprint: arXiv;
- presentation: overleaf, speakerdeck;
- supplementary material: suppl.tex.
Members of the project (alphabetical order): Gisele M. Lourenço Benevides, Sueli Mara S. P. Ferreira, Adriano de Jesus Holanda, Osame Kinouchi, Mariane Matias.
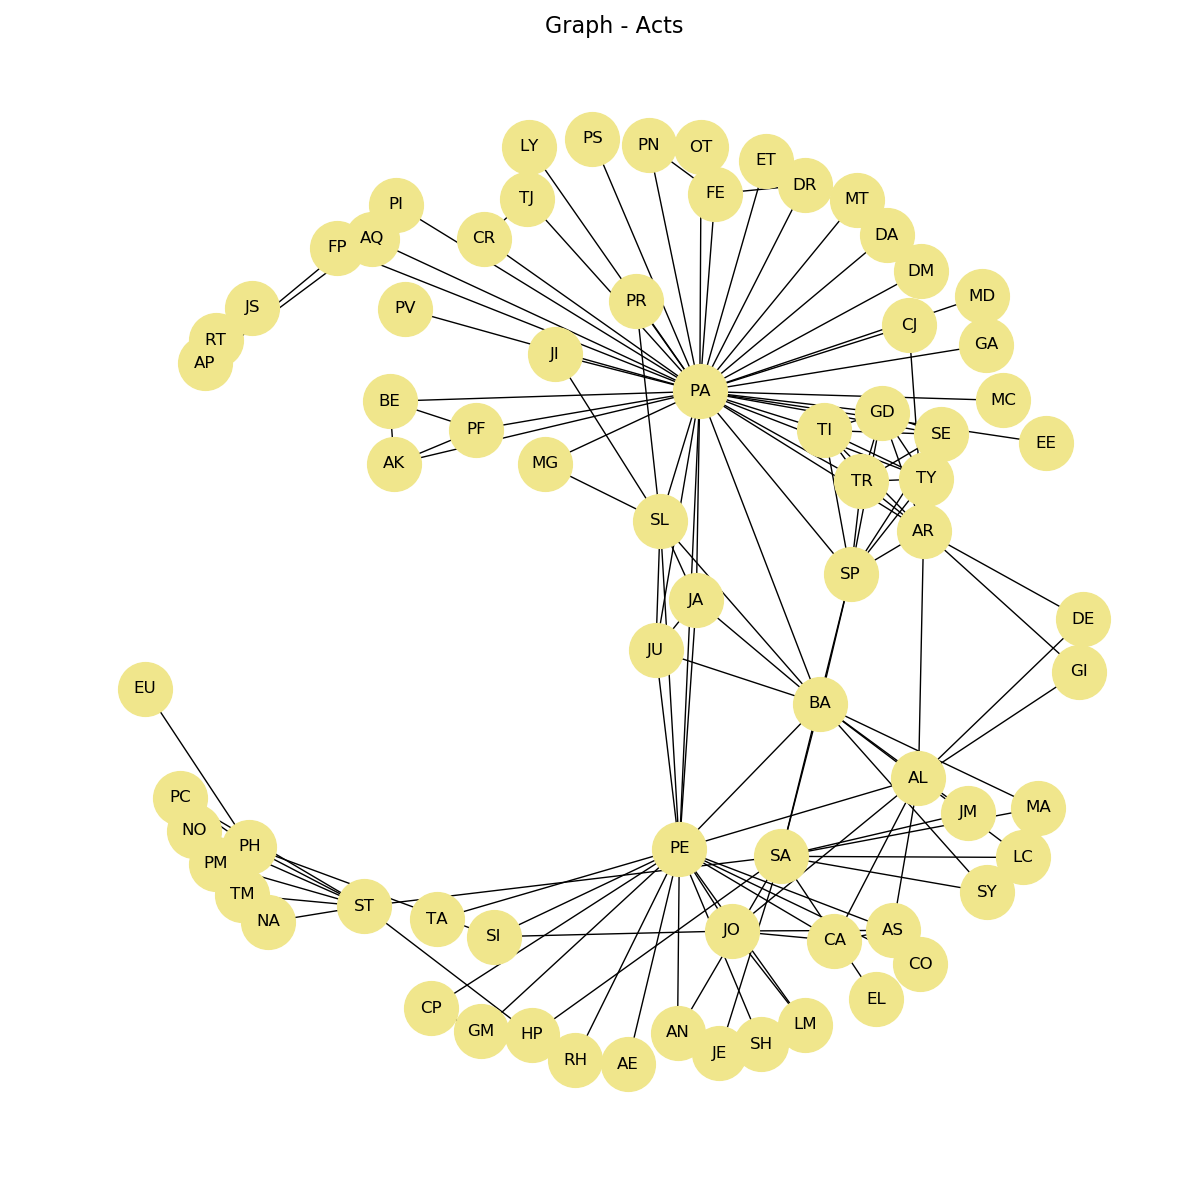
CharNet is a study of complex networks properties of books where characters represent the nodes and the interaction between them are edges. The data were gathered from the following books:
- [Acts] Holy Bible’s Acts of Apostles.
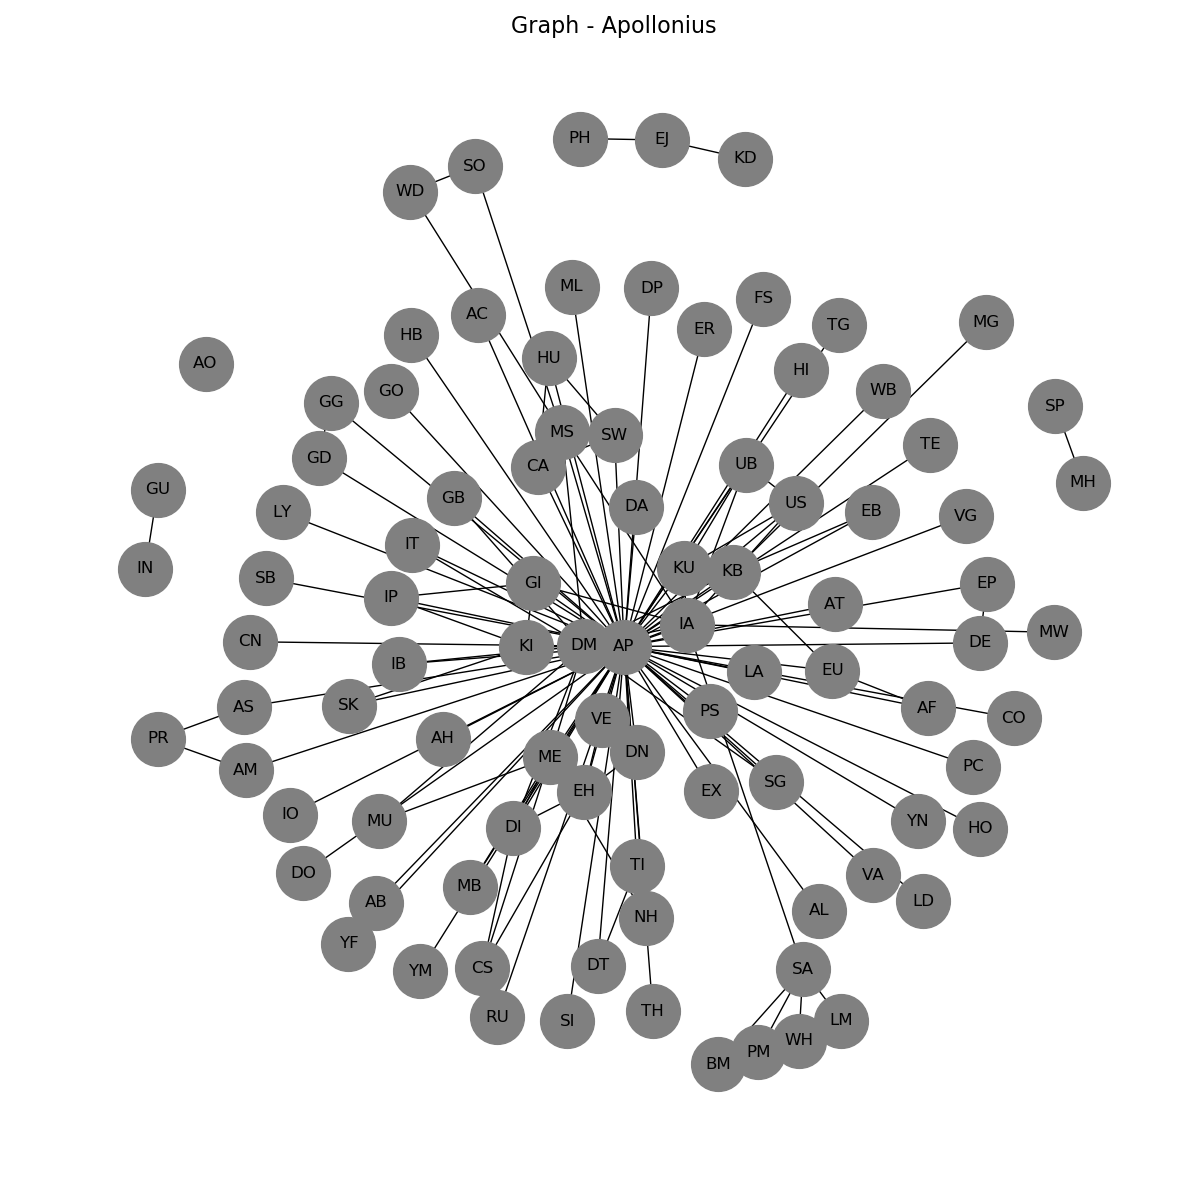
- [Appolonius] The Life of Apllonius of Tyana, Flavius Philostratus. Translated to english by Frederick Cornwallis Conybeare. (If you downloaded the book, please read carefully the instructions at first page)
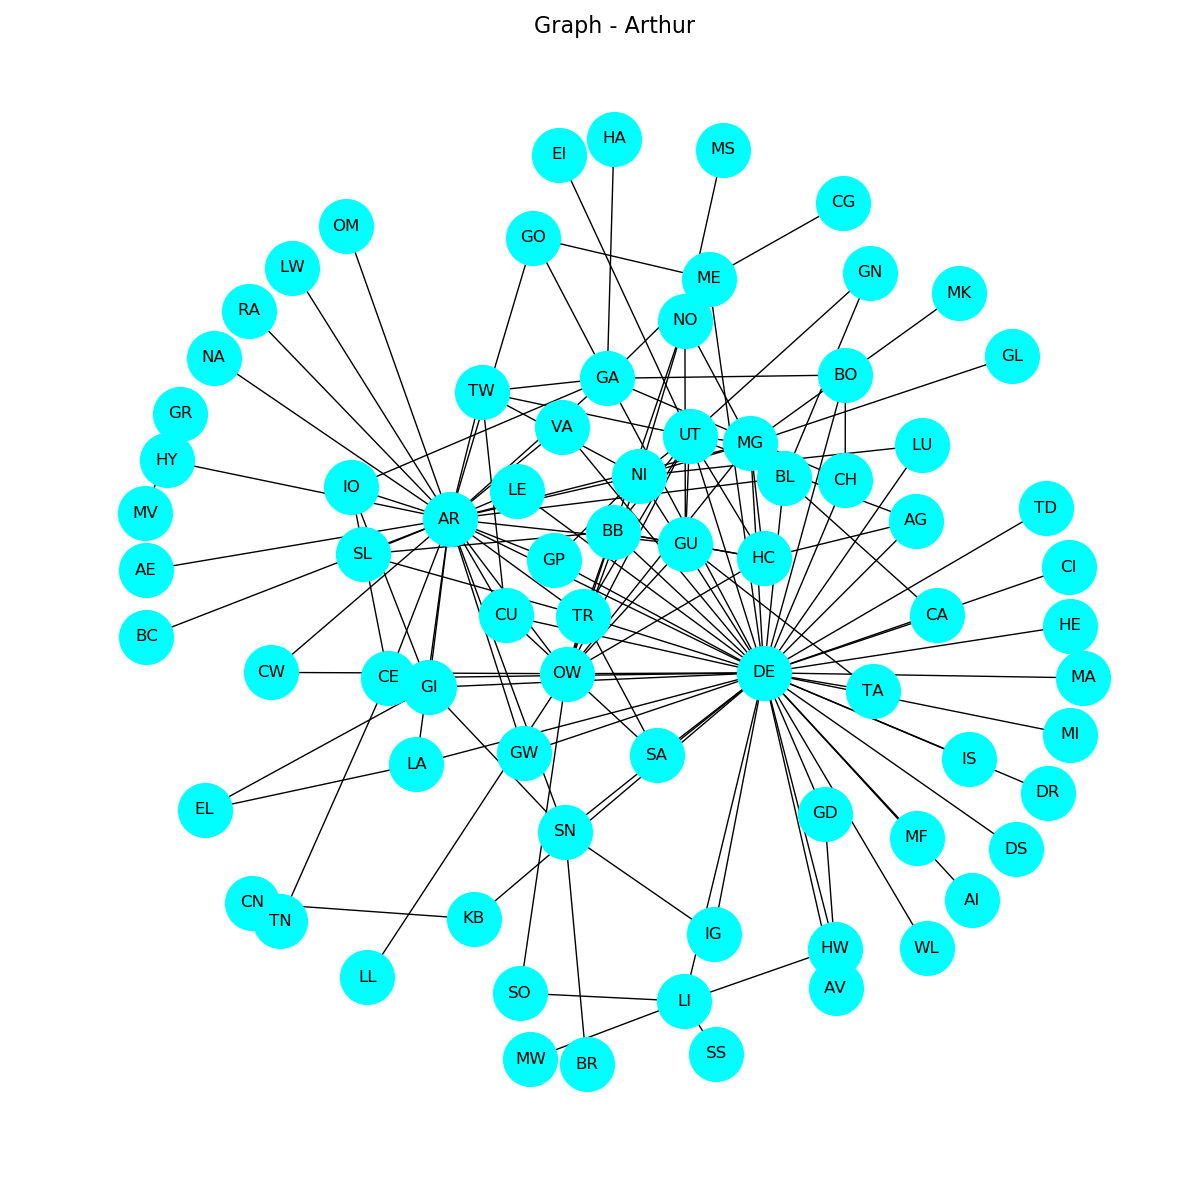
- [Arthur] O Rei do Inverno - As crônicas de Artur, Vol. 1; by Bernard Cornwell. (King Arthur chronicles)
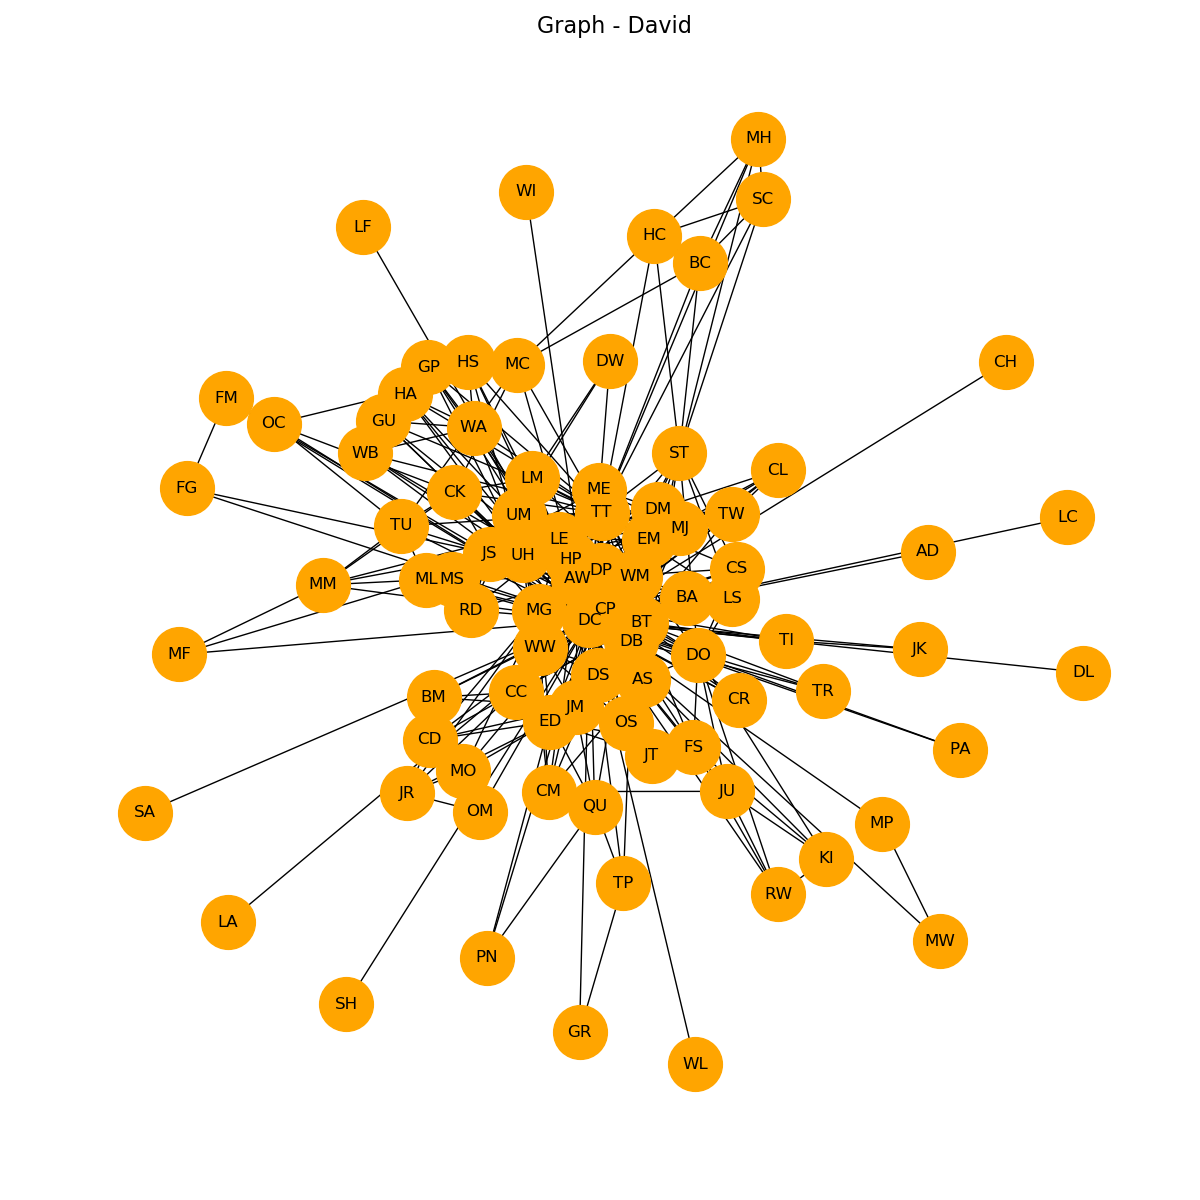
- [David] David Copperfield, by Charles Dickens.
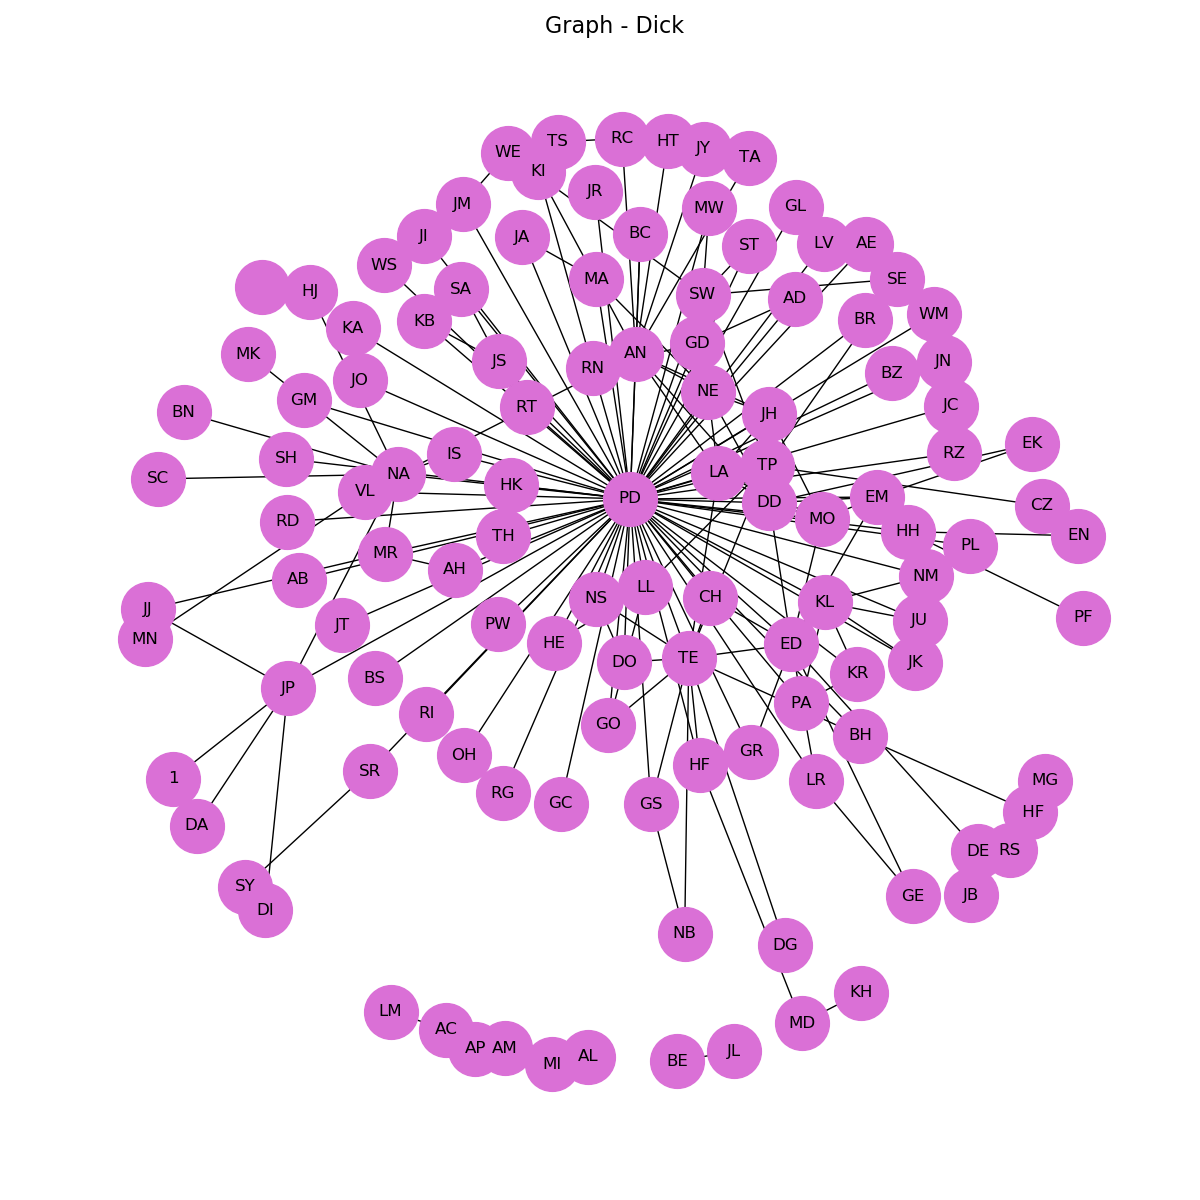
- [Dick] A Life of Philip K. Dick, by Anthony Peake.
- [Hawking] Minha Breve História, by Stephen Hawking. Editora Intrínseca, 2013. Stephen Hawking biography
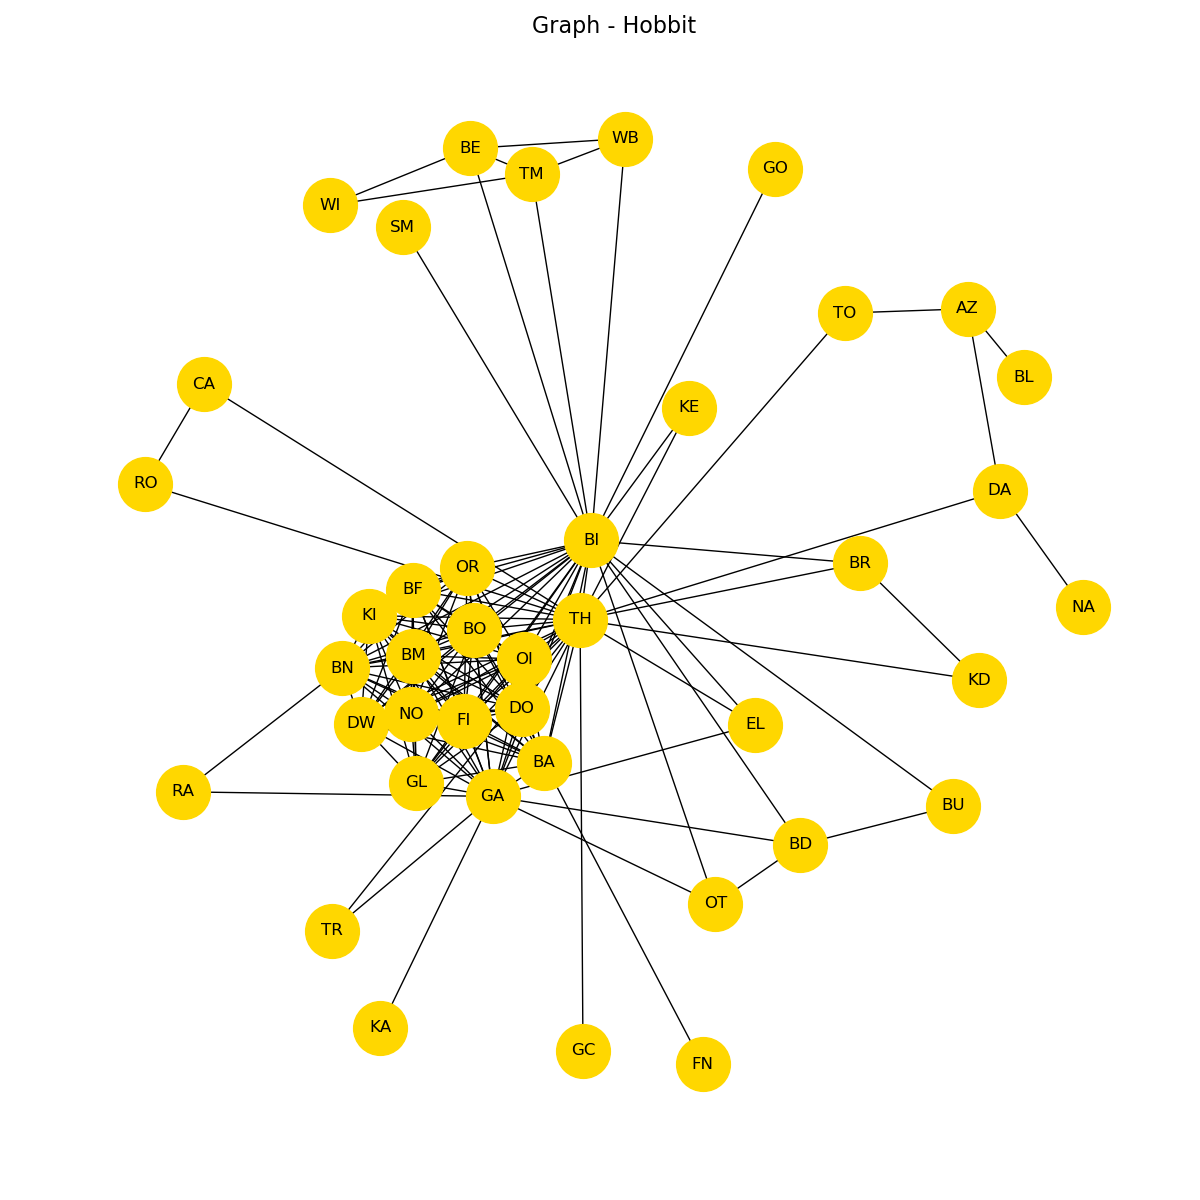
- [Hobbit] Hobbit, by J. R. R. Tolkien. Editora Martins Fontes, 2014. ISBN 9788578278953
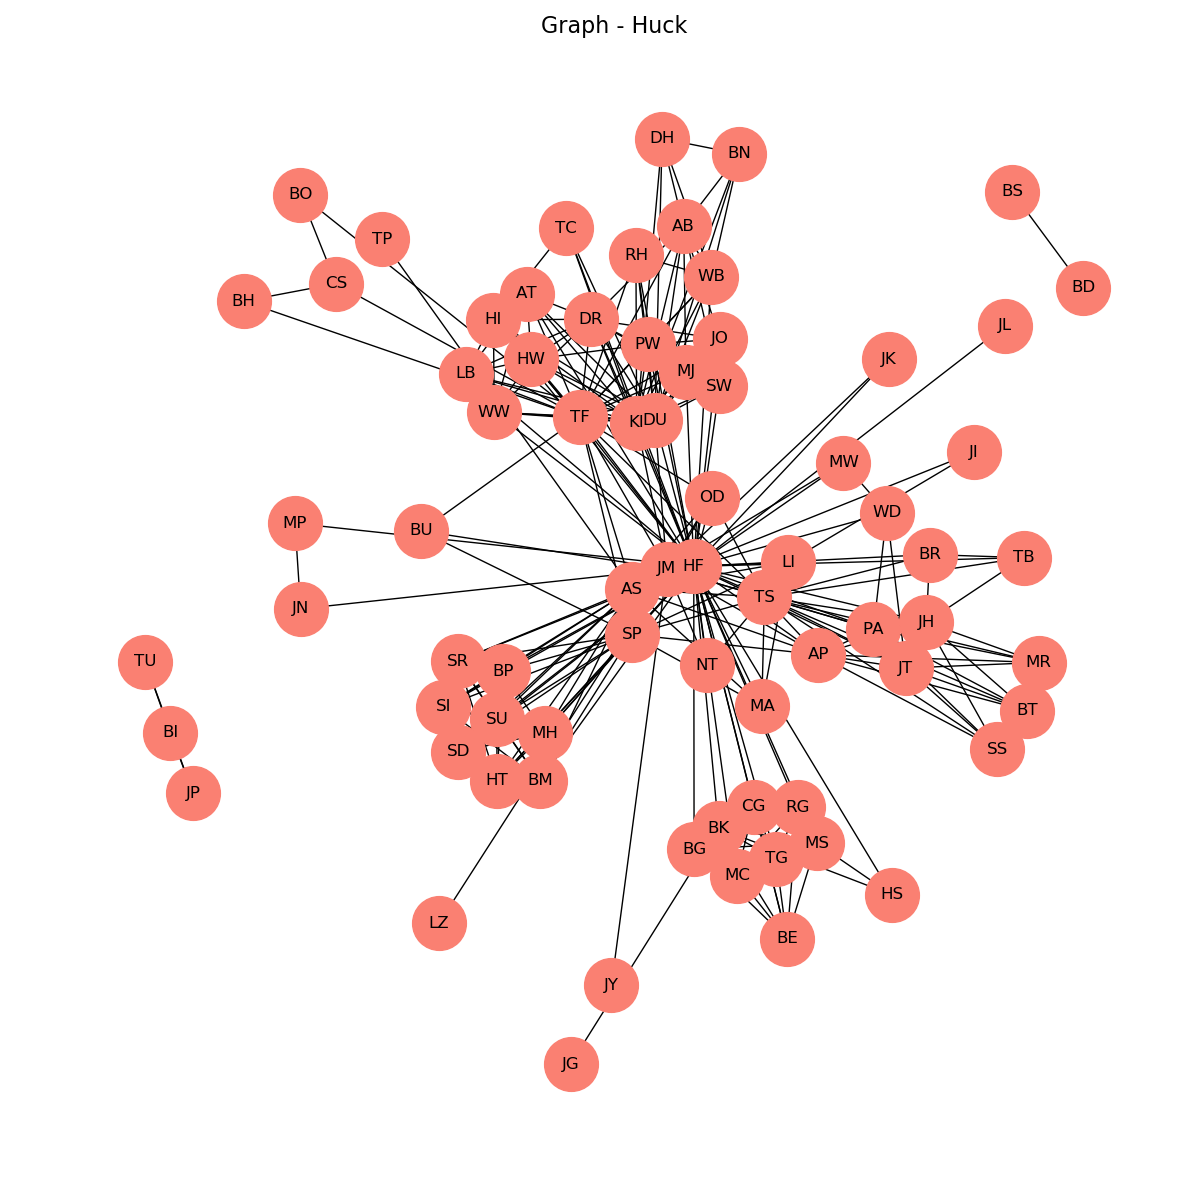
- [Huck] Huckleberry Finn, by Mark Twain.
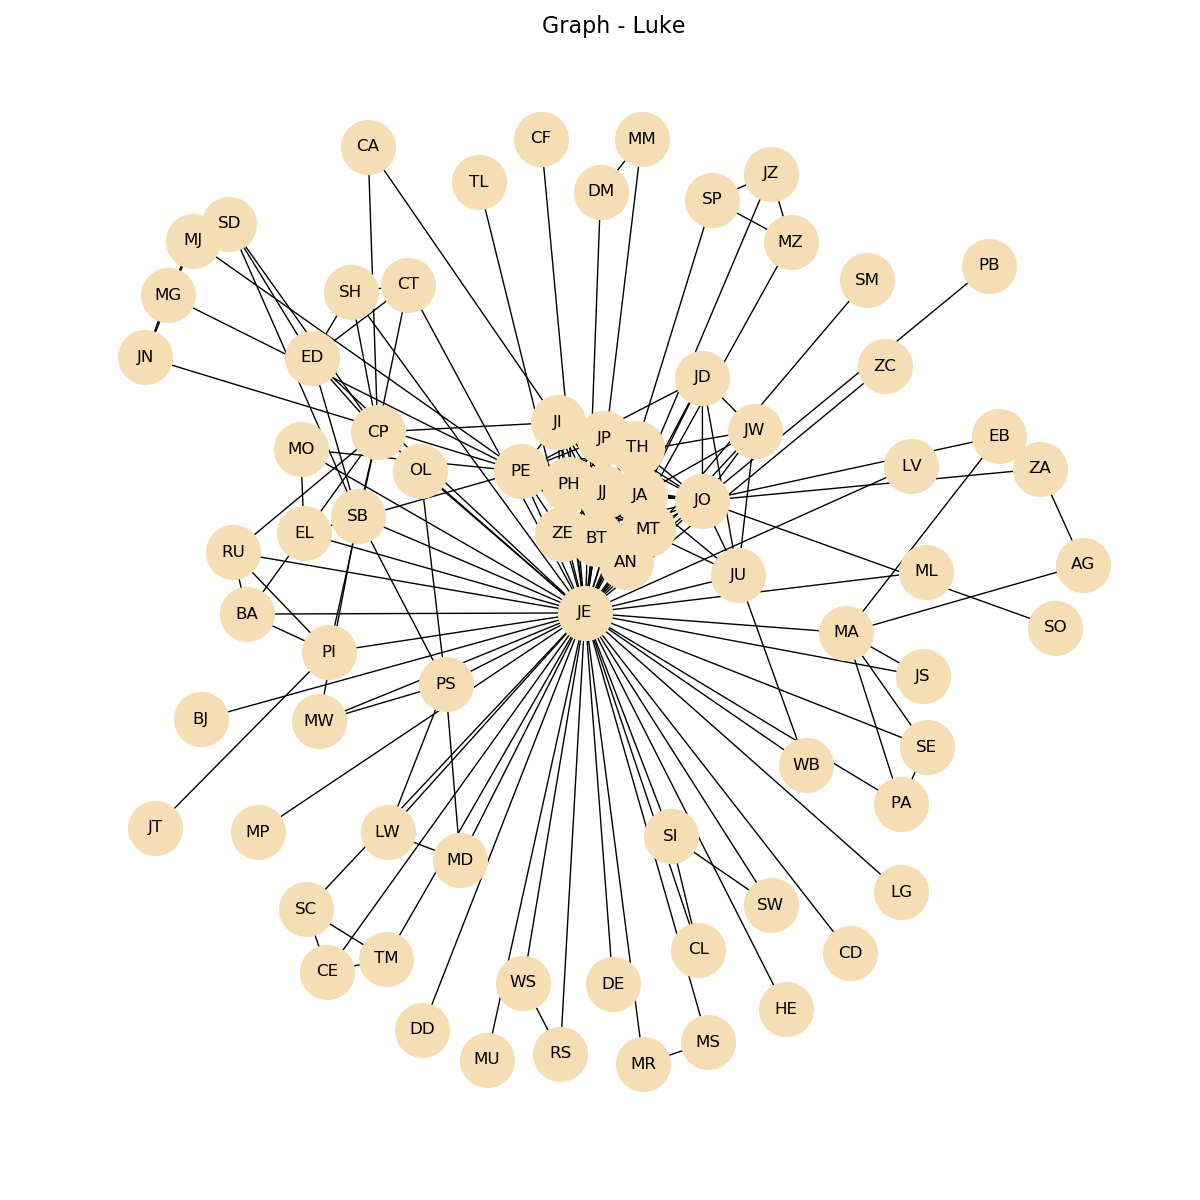
- [Luke] Holy Bible’s Luke Gospel.
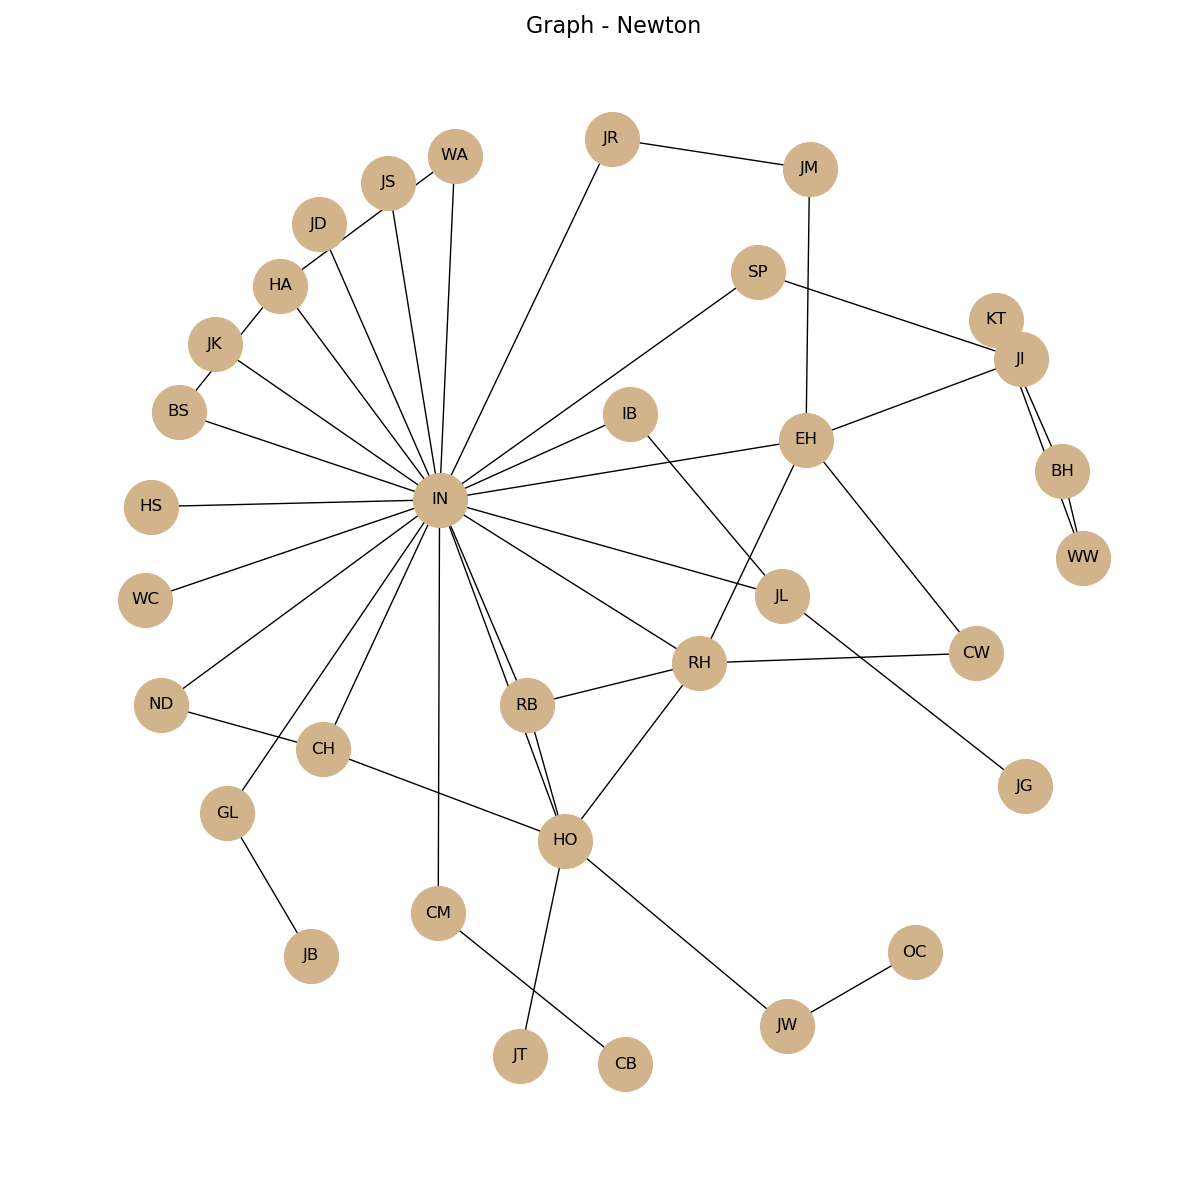
- [Newton] Isaac Newton, uma biografia, by James Gleick. Companhia das Letras, 2004, ISBN 8535904646.
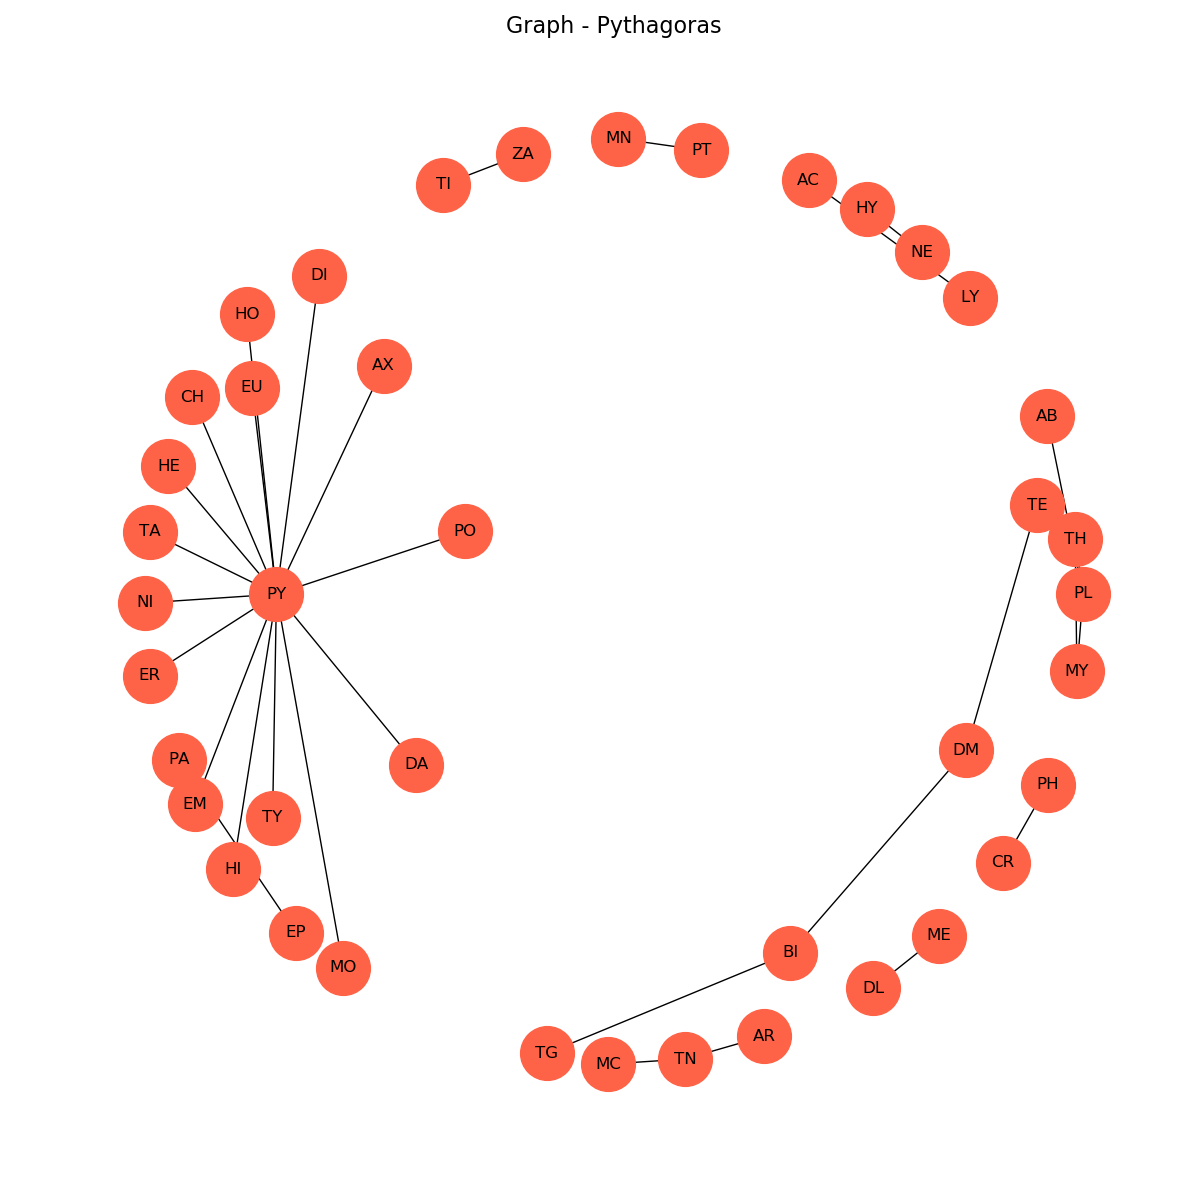
- [Pythagoras] The Life of Pythagoras, by Iamblichus. Theosophical Publishing House, 1915.
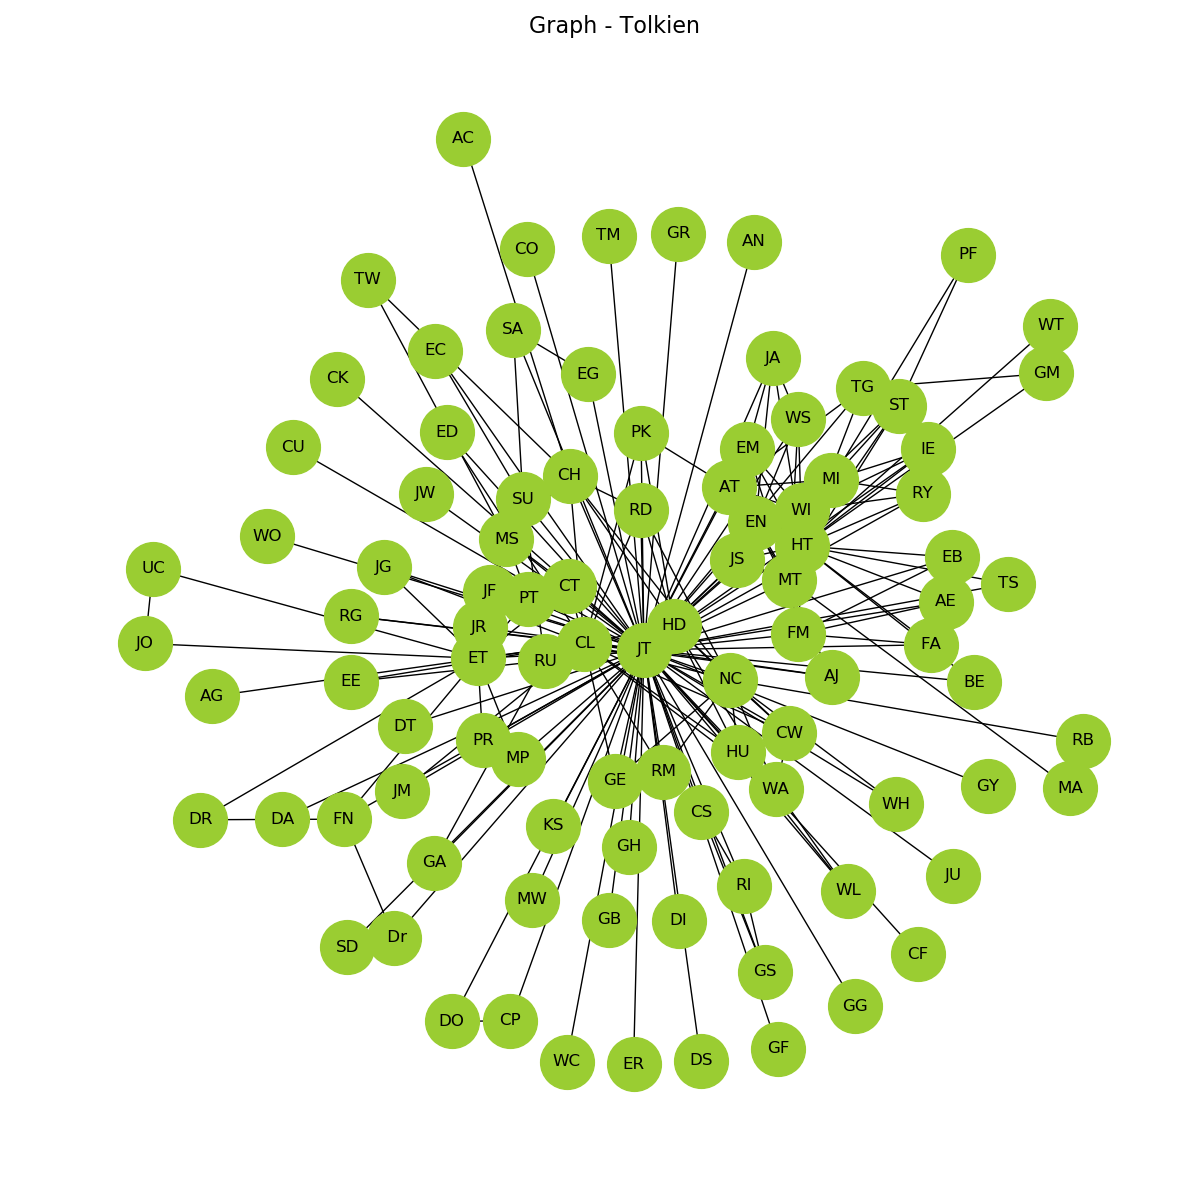
- [Tolkien] J. R. R. Tolkien: o senhor da fantasia, by Michael White. DarkSide Books, 2013. ISBN 9788566636642
Data from Holy Bible were gathered using AMERICAN HOLY BIBLE (ASV) Special Illustrated Edition with Interactive Table of Contents - Complete Old Testament & New Testament - ASV Bible / ASV Holy … - Revised American Standard Version Book 1).
The data from david and huck were compiled by Donald E. Knuth for his book Stanford GraphBase (SGB).
Gathered Data
The following files contain graphs created using the characters as nodes and the encounters between those characters as edges:
- Acts of Apostles;
- Apollonius of Tyana;
- Arthur biography;
- David Copperfield;
- Dick’s biography;
- Hobbit;
- Huckleberry Finn;
- Luke Gospel;
- Newton biography;
- Pythagoras biography;
- Tolkien biography.
The format follows the SGB graph data representation for books, for example the content
* File "example.dat"
* Comments
AA character A from country A
AB character A from city B
BC character B married with CC
CB character C married with BC

1:AA,BC;AA,AB,BC
2:AA,BC,CB
* End of file "example.dat"
represents the file example.dat that contains four nodes {AA,
AB, BC, CC}. After the node label, there is a space and then the
node description. The edges list starts after a empty line, the number
at the starting of line represents the chapter or verse, and after the
comma starts the list of encounters separated by semicolon. For
example, in the chapter or verse 1, AA meets BC and after some
period of time AA, AB and BC meet themselves. The asterisk
symbol is used to start comments.
Graph Drawing
The graphs were drawn using Python libraries NetworkX and matplotlib.
Results and Analysis
We described in the manuscript the main results and analyses with the following aims:
- Compare the frequency distribution of characters;
- Compare the frequency of characters that appear only once in the entire book;
- Compare the Lobby centrality with degree, betweenness and closeness centralities.
Information about degree, closeness and betweenness can be found at Wikipedia. Lobby index information can be found in the Campiteli’s paper.
Source code
The source code of the project was versioned using a github repository.